How a matrix organization works
Picture a grid. The columns are functions such as engineering and marketing; the rows are products or projects. Each person sits at a crossing point. The functional head decides how the work is done, develops skills and usually runs performance reviews. The product or project manager decides what is done and when, and is accountable for the result.
On an org chart, one of the two lines is drawn solid and the other dotted, depending on which manager has disciplinary authority. Textbooks distinguish a weak matrix (the functional manager dominates), a balanced matrix and a strong matrix (the project or product manager dominates). The matrix spread widely in the US aerospace and defence industry in the 1960s.
When a matrix fits, and when it does not
A matrix fits when several products or projects need the same scarce specialists and neither a pure functional nor a pure divisional structure works. It lets a company share experts flexibly and still give each product a clear owner.
It fails when the two managers' priorities are not reconciled. Employees then get conflicting instructions and spend time negotiating instead of working. Bartlett and Ghoshal argued in 1990 that a matrix works only if managers share a common frame of mind, not just a chart.
An illustrative example
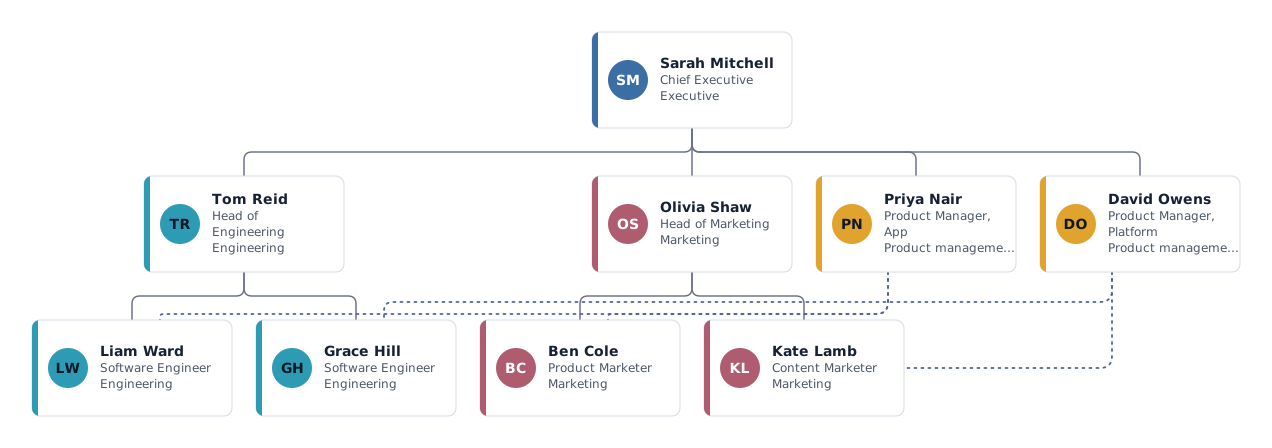
A software company has an engineering department and a marketing department, plus two product managers: one for the mobile app and one for the platform. A developer reports to the head of engineering, who decides on code standards and promotions, and works day to day with the app product manager, who sets the priorities for the sprint.
The example chart shows this with dotted lines from each engineer and marketer to their product manager. Both product managers report to the chief executive.
Advantages and disadvantages
| Advantages | Disadvantages |
|---|---|
| Specialists are shared flexibly across products or projects. | Two managers can give conflicting instructions. |
| Each product or project has a clear owner. | More meetings and coordination effort. |
| Knowledge flows across functional boundaries. | Unclear responsibility when things go wrong. |
| Faster response to market changes than a functional structure. | Stressful for employees caught between priorities. |
How to draw a matrix org chart in mivochart
- Build the functional line first: chief executive, functional heads, specialists.
- Add the product or project managers, usually as reports of the chief executive.
- Select a specialist, open the details and add their product manager under Dotted-line managers. The chart draws a dotted line.
- Use department colours for the functions and a separate colour for the product managers.
- Use search to jump to any person by name, title or department when you review who works on which product.
Related structures
Templates that use this structure
Prefer to start from a ready-made chart? These templates follow the same pattern and open in the editor with sample names.
Frequently asked questions
What is a matrix organization in simple terms?
It is a structure where you have two bosses: one for your profession (for example the head of engineering) and one for the product or project you work on. Each is responsible for a different part of your work.
What is the difference between a weak, balanced and strong matrix?
In a weak matrix the functional manager holds most authority and the project manager coordinates. In a strong matrix the project manager holds most authority. In a balanced matrix authority is shared.
How do you show a matrix on an org chart?
Draw the primary reporting line as a solid line and the second manager as a dotted line. Which line is solid depends on who has disciplinary authority, such as hiring and performance reviews.
Why do matrix organizations fail?
Usually because priorities between the two managers are not agreed, so employees must resolve conflicts themselves. Clear decision rules and joint planning between functional and product managers are essential.
Is a matrix the same as dotted-line reporting?
Dotted-line reporting is the drawing convention. A matrix is a structure where dual reporting is the rule for many people, not an exception for a few.
Sources and further reading
- Jay R. Galbraith, Designing Complex Organizations (1973): lateral relations and the matrix.
- Stanley M. Davis and Paul R. Lawrence, Matrix (1977).
- Christopher A. Bartlett and Sumantra Ghoshal, Matrix Management: Not a Structure, a Frame of Mind, Harvard Business Review (1990).
- Project Management Institute, PMBOK Guide: weak, balanced and strong matrix organizations.
Standard management textbook concepts. The example chart and the people in it are illustrative and fictional.